We'll Find Your Toronto Property
That Checks All the Boxes.
From explaining the Greater Toronto property market to hand-picking properties matching your search
criteria, we’ll position you to make a well-informed decision when buying a property in the GTA,
making your purchase process smooth sailing.

ATTENTION: Toronto Homebuyers
Buy Your Toronto Property With a Dedicated and Experienced Team
We love working with first-time and experienced buyers alike! Whether it’s your first property or you already have multiple transactions behind you, our goal is to make your property purchase as easy as possible.
Who are Our Perfect Buyer?
First-time home buyers
Luxury home buyers
New construction buyers
Move-up buyers
Investment property buyers
Relocation buyers
Downsizing buyers
Condo buyers
Renovation buyers
TESTIMONIALS
What others are saying
"Advocate in our corner"
"Phenomenal from start to finish. Every time we had a question, Danny replied within minutes, not days, and he kept us calm with clear, straightforward updates."
- Lori Francis

"Professional & knowledgeable"
"Following the cancellation of that listing, we turned to Danny Macedo on the recommendation of a friend who had experienced success with him. Remarkably, within just three weeks of listing with Danny, we received an offer that met our expectations"
- Mark Elliott
"Highly recommend"
"Selling our home with Danny’s team was the smoothest experience we’ve ever had in real estate. They were incredibly responsive, whether it was a quick text question or a last-minute showing request, a nd we never once felt left in the dark. ."
- Mike Groves
Royal LePage® Supreme Realty, Brokerage
110 Weston Road
Toronto, ON M6N 0A6
Call 416-535-8000
Text 647-931-5151


Copyright 2026. Macedo Real Estate Group, Danny Macedo, Sales Representative, Anthony Rocco Macedo, Sales Representative, Royal LePage Supreme Realty, Brokerage all rights reserved assumes no responsibility for the accuracy of any information shown. The information provided herein must only be used by consumers that have a bona fide interest in the purchase, sale or lease of real estate and may not be used for any commercial purpose or any other purpose.
Elite Broker Blogs
━━━━━━━━
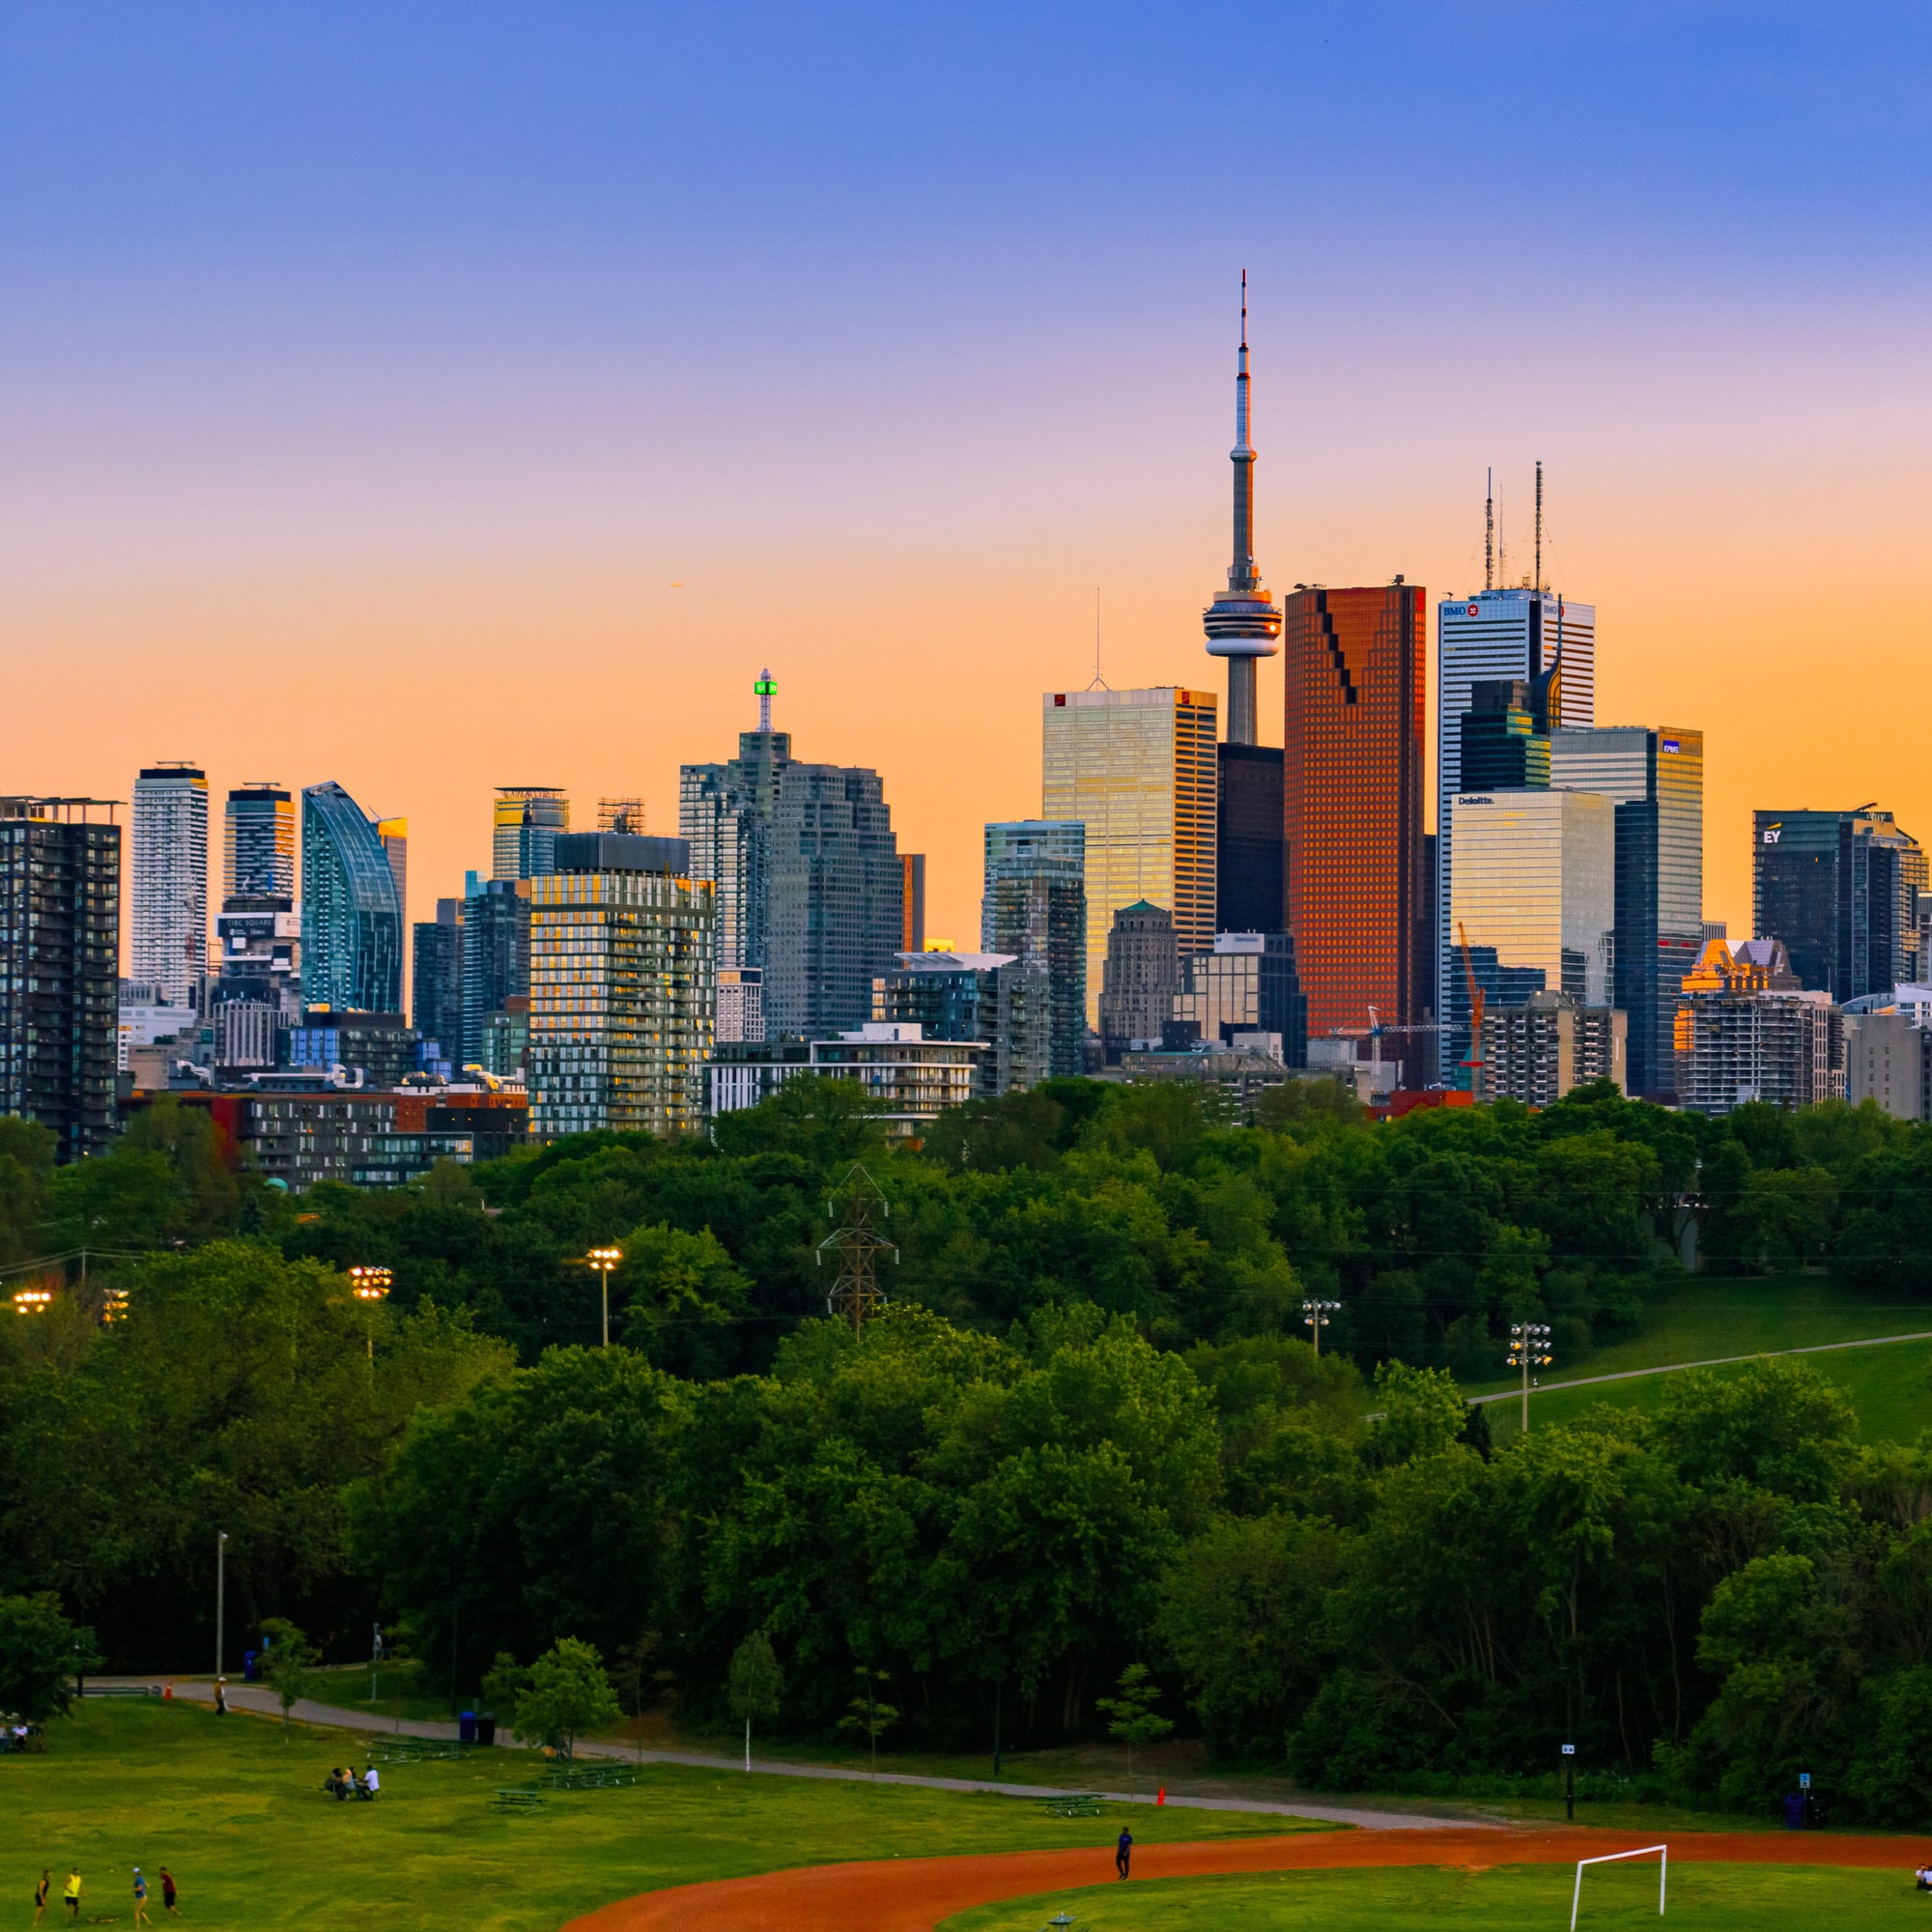
North York in July 2026: What C12, C14 and C15 Actually Cost
All figures in this article are taken from the Toronto Regional Real Estate Board Market Watch report for July 2026, released on 6 August 2026. Averages describe a whole area over a single month. They do not describe your house.
North York is not one market. TRREB splits it across several districts, and in July 2026 three of them behaved so differently that treating them as a single area would mislead you badly.
The three districts, all property types, July 2026
| District | Sales | Average price | Median price | LDOM | SP to LP |
|---|---|---|---|---|---|
| Toronto C12 | 26 | $3,403,938 | $2,640,000 | 42 | 93% |
| Toronto C14 | 90 | $891,304 | $643,000 | 38 | 97% |
| Toronto C15 | 115 | $910,683 | $740,000 | 33 | 98% |
For reference, the City of Toronto as a whole averaged $1,010,836 across 2,242 sales, with a median of $800,000.
Read the gap between average and median
In C12, the average was $3,403,938 and the median was $2,640,000. The average sits roughly 29 per cent above the median.
In C14, the average was $891,304 and the median was $643,000. The average sits roughly 39 per cent above the median.
In C15, the figures were $910,683 and $740,000, a gap of roughly 23 per cent.
A large gap means the average is being pulled up by a smaller number of expensive sales. In C14, where the gap is widest, the typical property that changed hands in July sold for considerably less than the average implies.
Now separate the property types
Most of that spread comes from mixing house types together. Detached houses only, July 2026:
| District | Detached sales | Average price | Median price | LDOM | SP to LP |
|---|---|---|---|---|---|
| Toronto C12 | 17 | $4,574,086 | $3,615,000 | 44 | 92% |
| Toronto C14 | 20 | $1,744,800 | $1,457,500 | 43 | 95% |
| Toronto C15 | 24 | $1,753,167 | $1,363,000 | 36 | 95% |
Two things become clear immediately.
First, C14 and C15 look almost identical on detached average price, $1,744,800 against $1,753,167. On the all-types figures they looked similar too, but for a different reason. C14 sold 90 properties of which only 20 were detached. C15 sold 115 of which 24 were detached. In both districts the majority of July activity was not detached houses.
Second, C12 is a genuinely different market. Seventeen detached sales at an average of $4,574,086, taking 44 days to sell and achieving 92 per cent of asking price. That last figure is the lowest of the three by a clear margin.
What 92 per cent of asking actually means
On a property listed at $4,000,000, achieving 92 per cent rather than 97 per cent is a difference of $200,000.
Across the City of Toronto in July 2026, the average was 97 per cent. C12 came in five percentage points below that. On the price levels involved in C12, five percentage points is a large sum of money, and it is the single strongest argument for treating the listing price in that district as a strategic decision rather than an aspiration.
The honest caveat
Seventeen detached sales is a small sample. So is 20, and so is 24. One unusual property can move a monthly average in any of these districts. That is exactly why I have shown you the median alongside the average every time, and why I would not price a house off a single month of data in any of them.
What a single month is good for is direction and context. If you are selling in C12 and you are working from a City of Toronto average, you are using a number that has almost nothing to do with your property. If you are selling in C14 and quoting the district average of $891,304 without checking whether you are in the detached half or the condominium half, you are doing the same thing in reverse.
Before you do anything else
Want to know what your home would actually sell for today? Run the Home Worth report on my site, or text me at 647-931-5151 and I will walk you through it.
Danny Macedo, Macedo Real Estate Group, Royal LePage Supreme Realty, Brokerage. Selling in Toronto and York Region since 1996.