
Have a Question or Query?
Reach Out to Us!
Whether it's over email, via text message or over the phone, don't hesitate to contact us regarding any
questions or queries you have about Greater Toronto property market.

Royal LePage® Supreme Realty, Brokerage
110 Weston Road
Toronto, ON M6N 0A6
Call 416-535-8000
Text 647-931-5151


Copyright 2026. Macedo Real Estate Group, Danny Macedo, Sales Representative, Anthony Rocco Macedo, Sales Representative, Royal LePage Supreme Realty, Brokerage all rights reserved assumes no responsibility for the accuracy of any information shown. The information provided herein must only be used by consumers that have a bona fide interest in the purchase, sale or lease of real estate and may not be used for any commercial purpose or any other purpose.
Elite Broker Blogs
━━━━━━━━
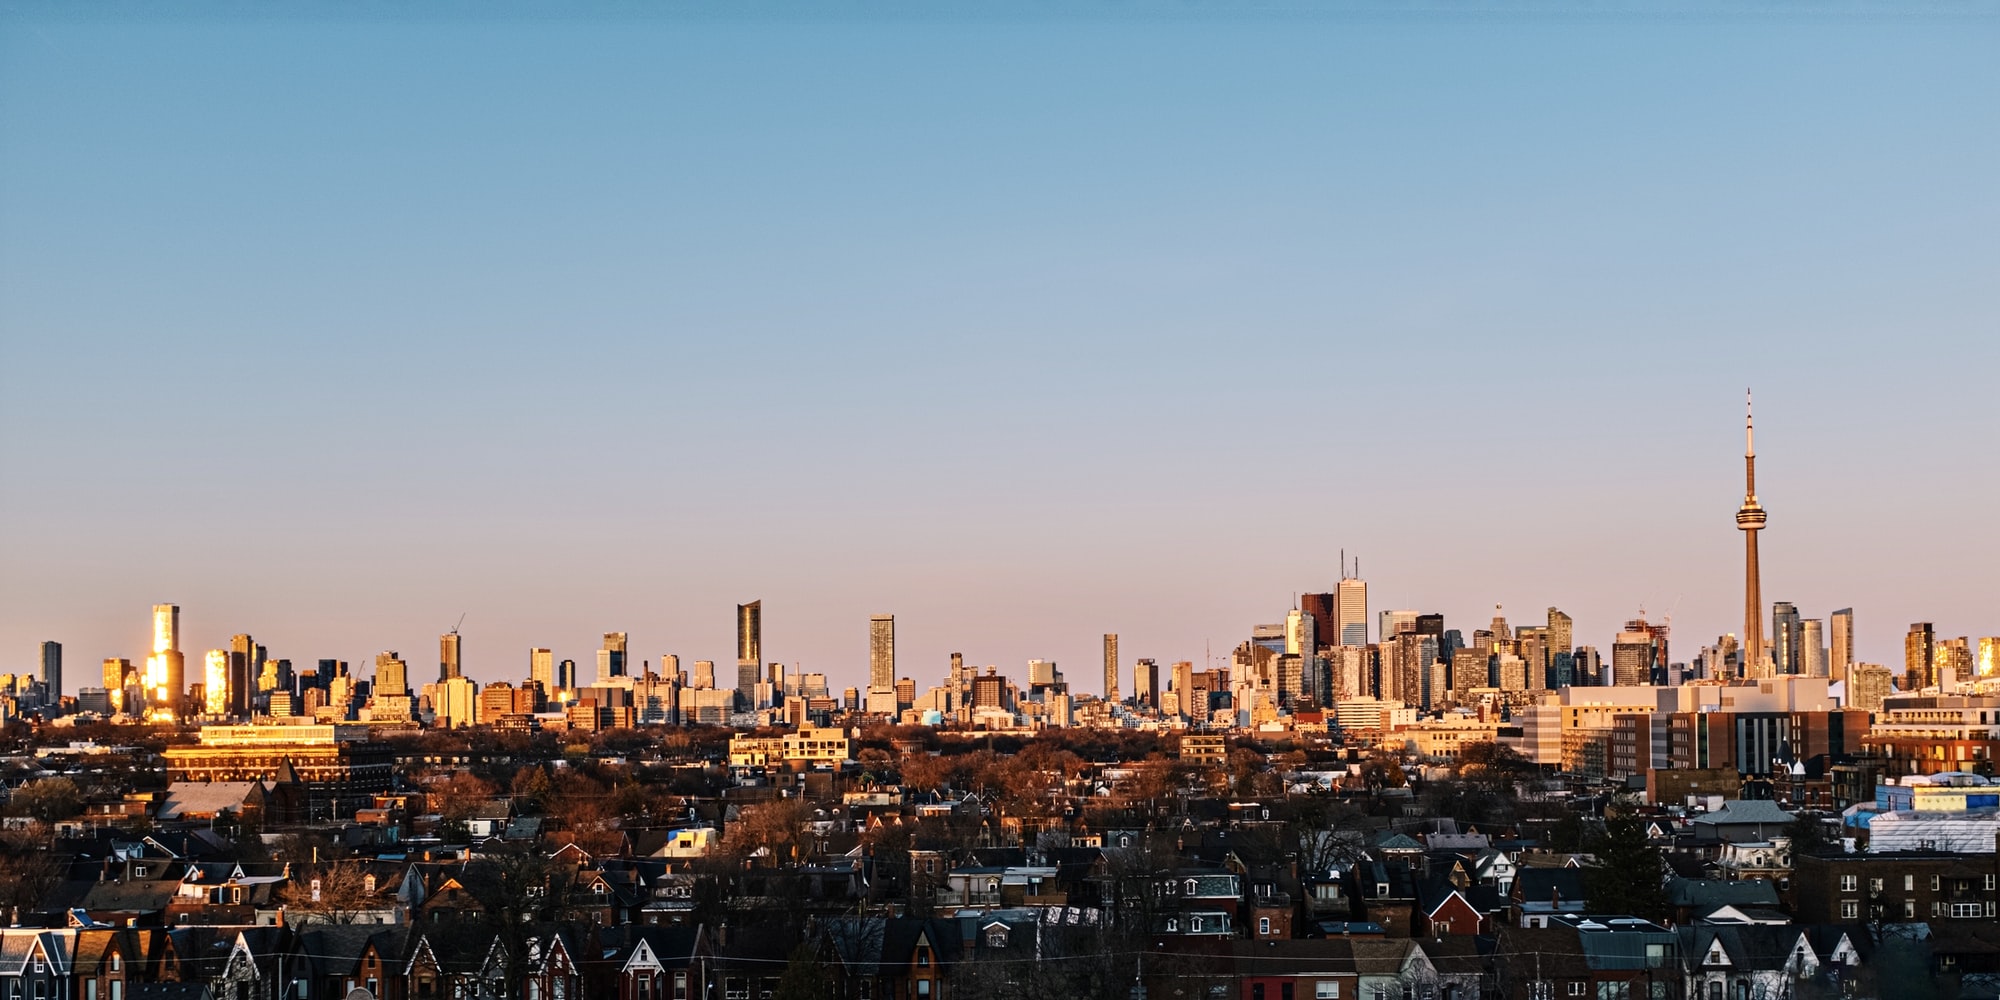
August 2026 in the GTA: Supply Tightens as New Listings Drop 14.1 Per Cent
TRREB released its August 2026 data on September 3, and the headline is not about price. It is about supply. New listings entered into the MLS system amounted to 12,075, down 14.1 per cent compared to August 2025. Active listings fell 11.3 per cent year over year to 24,482. Fewer homes are coming to market, and the pool of available inventory is shrinking.
Sales came in at 5,057, down 2.1 per cent from 5,168 in August 2025. The average selling price was $993,410, a decline of 2.7 per cent from $1,021,300 a year earlier. The MLS Home Price Index composite benchmark was down 4.5 per cent year over year.
Prices are still softer than last year, but the supply picture underneath them is changing.
The Supply Side Is the Story
A market with falling inventory and relatively flat sales puts upward pressure on prices over time. That has not happened yet. But the sales to new listings ratio, which measures how many of the new listings are being absorbed by buyers, sat at 37.5 per cent in August. Months of inventory stood at 4.6.
For context, a balanced market is typically defined as four to six months of inventory. The GTA sits squarely in that range right now. But the direction matters more than the snapshot. New listings have been declining, and if that trend holds through the autumn, inventory will tighten further.
TRREB President Daniel Steinfeld put it this way in the August release: buyers may face a trade-off between waiting for greater economic certainty and purchasing before prices move higher.
What Happened by Home Type
Detached homes saw 2,399 sales across the GTA at an average price of $1,288,669. Within the City of Toronto, 550 detached homes sold at an average of $1,525,749. In the 905 regions, 1,849 detached homes sold at an average of $1,218,148.
Year over year, detached sales were up 0.5 per cent overall, one of the few categories to show a gain. Detached prices edged down 1.8 per cent across the GTA.
Semi-detached homes recorded 439 sales at an average of $931,665, with prices down 5.0 per cent year over year. Townhouses saw 832 sales at an average of $786,817, with prices down 8.6 per cent. Condos recorded 1,330 sales at an average of $617,593, with prices down 3.6 per cent.
Townhouses took the largest price correction of any home type in August. That segment has been softening for several months, and August continued the pattern.
York Region in Detail
York Region recorded 971 sales at an average price of $1,179,938 and a median of $1,041,800. Months of inventory sat at 5.0, slightly above the GTA average.
Vaughan saw 242 sales at an average of $1,234,758 and a median of $1,148,750. The sales to new listings ratio was 36.8 per cent with 4.9 months of inventory. For detached homes specifically, Vaughan recorded 122 sales at an average price of $1,671,824.
King Township remains the most expensive market in the region at an average price of $1,851,310, but it is also the slowest. Just 21 homes sold in August, and months of inventory reached 11.4, more than double the GTA average. Detached homes in King averaged $2,119,853 on only 17 sales. At that pace, King is firmly a buyer's market.
Markham was the busiest municipality in York Region with 282 sales at an average of $1,208,692. Richmond Hill recorded 161 sales at $1,205,777.
The Economic Backdrop
The Bank of Canada overnight rate stood at 2.3 per cent in August, with a prime rate of 4.5 per cent. Posted mortgage rates remain elevated: 5.49 per cent for a one year fixed, 6.05 per cent for three years, and 6.09 per cent for five years.
Toronto employment growth was 1.5 per cent in July, with unemployment at 6.8 per cent. Inflation ran at 3.0 per cent year over year. GDP growth in the first quarter of 2026 was negative 0.1 per cent.
TRREB Chief Information Officer Jason Mercer noted that ownership housing in the GTA has remained relatively affordable over the past year, with average prices dipping and mortgage rates remaining somewhat flat. The main holdback for many households, he said, has been concerns around trade with the United States and the potential for higher inflation and borrowing costs.
What to Watch in September
The autumn market will tell us whether the inventory decline is a seasonal dip or the start of a tighter cycle. If new listings continue to fall at anything close to 14 per cent year over year, the months of inventory number will drop below 4.0 by the end of the year, and that is when price pressure typically returns.
For now, the market sits in balance. Sellers are not listing in the numbers they were a year ago, and buyers are not rushing in either. The question is which side moves first.
Source: TRREB Market Watch, August 2026. All figures are for the TRREB market area unless otherwise noted.
If you want to know what these numbers mean for your specific neighbourhood or your home's value, call me at 416-560-4983. I will pull the data for your street and walk you through it.
Danny Macedo
REALTOR®, Macedo Real Estate Group
Royal LePage Supreme Realty, Brokerage
416-560-4983