
Your Best Resource for Exploring Greater Toronto Property Market
Backed by market expertise and modern strategies, Macedo Real Estate Group delivers a personalized real estate experience with deep local knowledge.
Our dedicated agents help clients find their place in the world with integrity, discretion and a focus on results.

Macedo Real Estate Group: Elevating Luxury Real
Estate Experiences
━━━━━━━━
Since 1996, Macedo Real Estate Group at Royal LePage® Supreme Realty Brokerage, has been a trusted leader in luxury real estate, guiding discerning buyers and sellers through every phase of the property journey. With a wealth of expertise honed over three decades, Danny and his team combine deep market insight with an unwavering commitment to delivering a seamless, personalized experience.
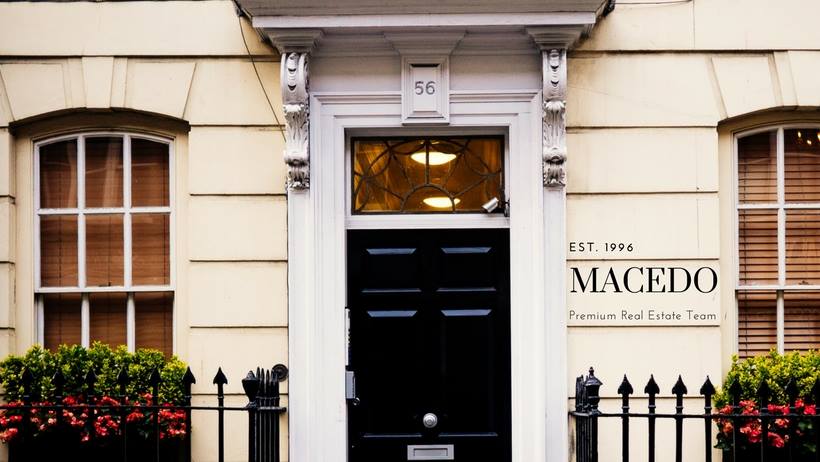
What Are You Looking To Do in Toronto?
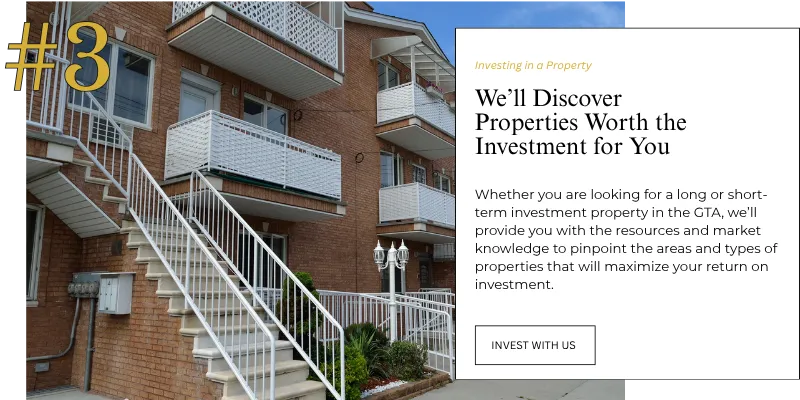
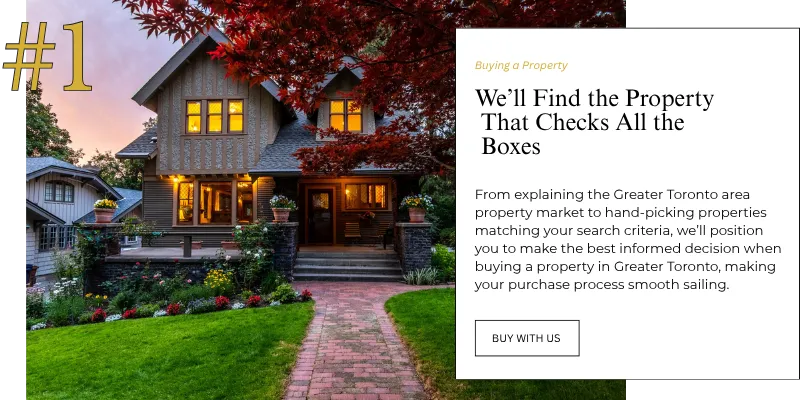
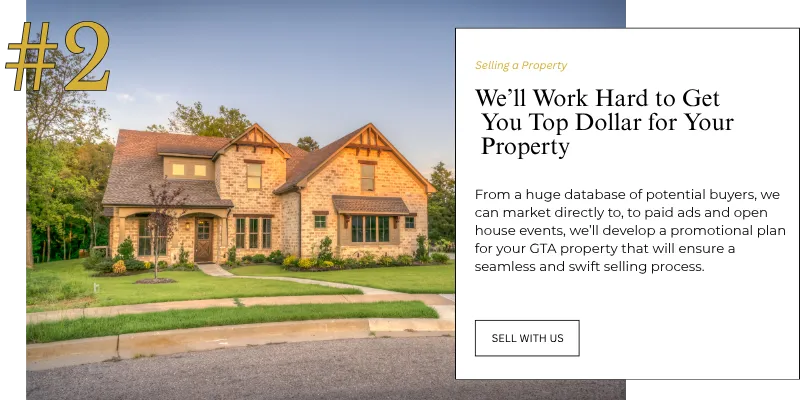
Local Knowledge. Connected Reach.
Our team knows your neighborhood inside and out, providing guidance you can trust at every step of your real estate journey. We take the time to understand your goals, whether you’re looking to buy your first home, sell your current property, or find your next investment. Using targeted marketing strategies, professional photography, and the latest digital tools, we ensure your property stands out in the market and reaches the right buyers. With a network of connections and a commitment to clear communication, we handle the details so you can move forward with confidence, knowing your home is in the hands of local experts who care about your success.
Remarkable Homes, Inspired Living
At Macedo Real Estate Group, we believe where you live shapes how you live. That’s why we carefully match clients with homes that fit their lifestyle, whether you’re seeking city energy, quiet neighborhood streets, or a place to grow your dreams. Our team pairs local expertise with personalized guidance, helping you find not just a property, but a space that reflects who you are and how you want to live.
Where the GTA Actually Transacts: July 2026 Sales by Price Band
The average selling price across the Greater Toronto Area in July 2026 was $1,003,956. It is the number that gets quoted, and on its own it is close to useless, because almost nobody bought a home at that price.
A more useful question is where the market actually transacts. TRREB publishes a breakdown of every sale by price band and by home type, and it tells a different story from the headline.
Two thirds of the market sold under a million dollars
Of the 5,995 homes sold across TRREB areas in July 2026, 3,841 sold for less than $1,000,000. That is 64.1 per cent of the market.
The single busiest band was $1,000,000 to $1,249,999, with 942 sales. Below it, $800,000 to $899,999 recorded 730 sales and $700,000 to $799,999 recorded 695.
This is why the median matters. The median selling price in July was $860,000, which sits inside the $800,000 to $899,999 band. The average, at $1,003,956, sits roughly $144,000 higher. The gap is not an error. It is the arithmetic of a small number of very expensive sales pulling a mean upwards while the middle of the market stays where it is.
The top of the market is small and it is almost entirely detached
Sales at $2,000,000 and above numbered 302 in July 2026. That is 5.0 per cent of all sales.
Of those 302 sales, 267 were detached houses. That is 88.4 per cent of the top band in a single home type.
Widen it slightly. Everything at $1,500,000 and above came to 685 sales, or 11.4 per cent of the market. So roughly one sale in nine happened above $1.5 million, and roughly one in twenty happened above $2 million.
If you own at that end of the market, this is the most important line in the report. You are not competing in the same market as the headline average. You are competing in a much thinner one, where there are fewer buyers, fewer comparable sales to price against, and consequently more room for a pricing error to cost you real money.
Home type decides which band you are in
The July split by type was this. Detached houses accounted for 2,789 sales, or 46.5 per cent. Condominium apartments accounted for 1,564 sales, or 26.1 per cent. Attached and row townhouses came to 567, semi-detached to 557, and condominium townhouses to 436.
Those two large categories sit at opposite ends of the price range. The average detached sale price was $1,291,690. The average condominium apartment sale price was $636,323.
Follow that through into the bands and the pattern is stark. In the $400,000 to $499,999 band there were 490 sales, and 422 of them were condominium apartments. That is 86.1 per cent of the band in one home type. In the $1,000,000 to $1,249,999 band there were 942 sales, and 680 of them were detached houses, which is 72.2 per cent.
So the GTA is not one market with an average price. It is at least two markets that barely overlap, reported under a single heading.
What to do with this
If you are selling, find your band before you look at any average. Take your home type and your realistic price range, and ask how many homes like yours actually sold last month. A seller in the busiest band is operating in a market with hundreds of recent comparable sales. A seller above $2 million is operating in a market with 302 sales across the entire region, most of them detached houses.
Those two sellers need different pricing strategies, different marketing periods and different expectations about time. Handing both of them the same average price is how bad advice gets given.
If you are buying, the same table tells you where competition concentrates. The bands between $700,000 and $1,250,000 held 2,969 of the month's 5,995 sales, which is just under half the market in a range of about half a million dollars. That is where most buyers are, and that is where you should expect company.
Three questions worth asking
Whether you are buying or selling, these three will tell you more than any headline figure.
How many homes of my type, in my price band, sold in my area last month? What was the median, not the average, for that group? How does the number of active listings in my band compare with the number of sales in it?
Any agent working with real data can answer all three in a few minutes. The answers will be specific to your house rather than to the region, which is the entire point.
Source
All figures in this article are taken from the Toronto Regional Real Estate Board Market Watch report for July 2026, released 6 August 2026, specifically the Sales by Price Range and House Type table and the Summary of Existing Home Transactions. Percentages are calculated from the published sale counts and are shown above.
If you want to know which band your home actually sits in, and what sold in it last month, call or text me on 416-560-4983 and I will pull the numbers for your street.

Royal LePage® Supreme Realty, Brokerage
110 Weston Road
Toronto, ON M6N 0A6
Call 416-535-8000
Text 647-931-5151


Copyright 2026. Macedo Real Estate Group, Danny Macedo, Sales Representative, Anthony Rocco Macedo, Sales Representative, Royal LePage Supreme Realty, Brokerage all rights reserved assumes no responsibility for the accuracy of any information shown. The information provided herein must only be used by consumers that have a bona fide interest in the purchase, sale or lease of real estate and may not be used for any commercial purpose or any other purpose.