
SELLER RESOURCES
Free Home Seller Tools Practical tools to help GTA homesellers get
organized, compare properties, understand the market, and move forward with confidence.
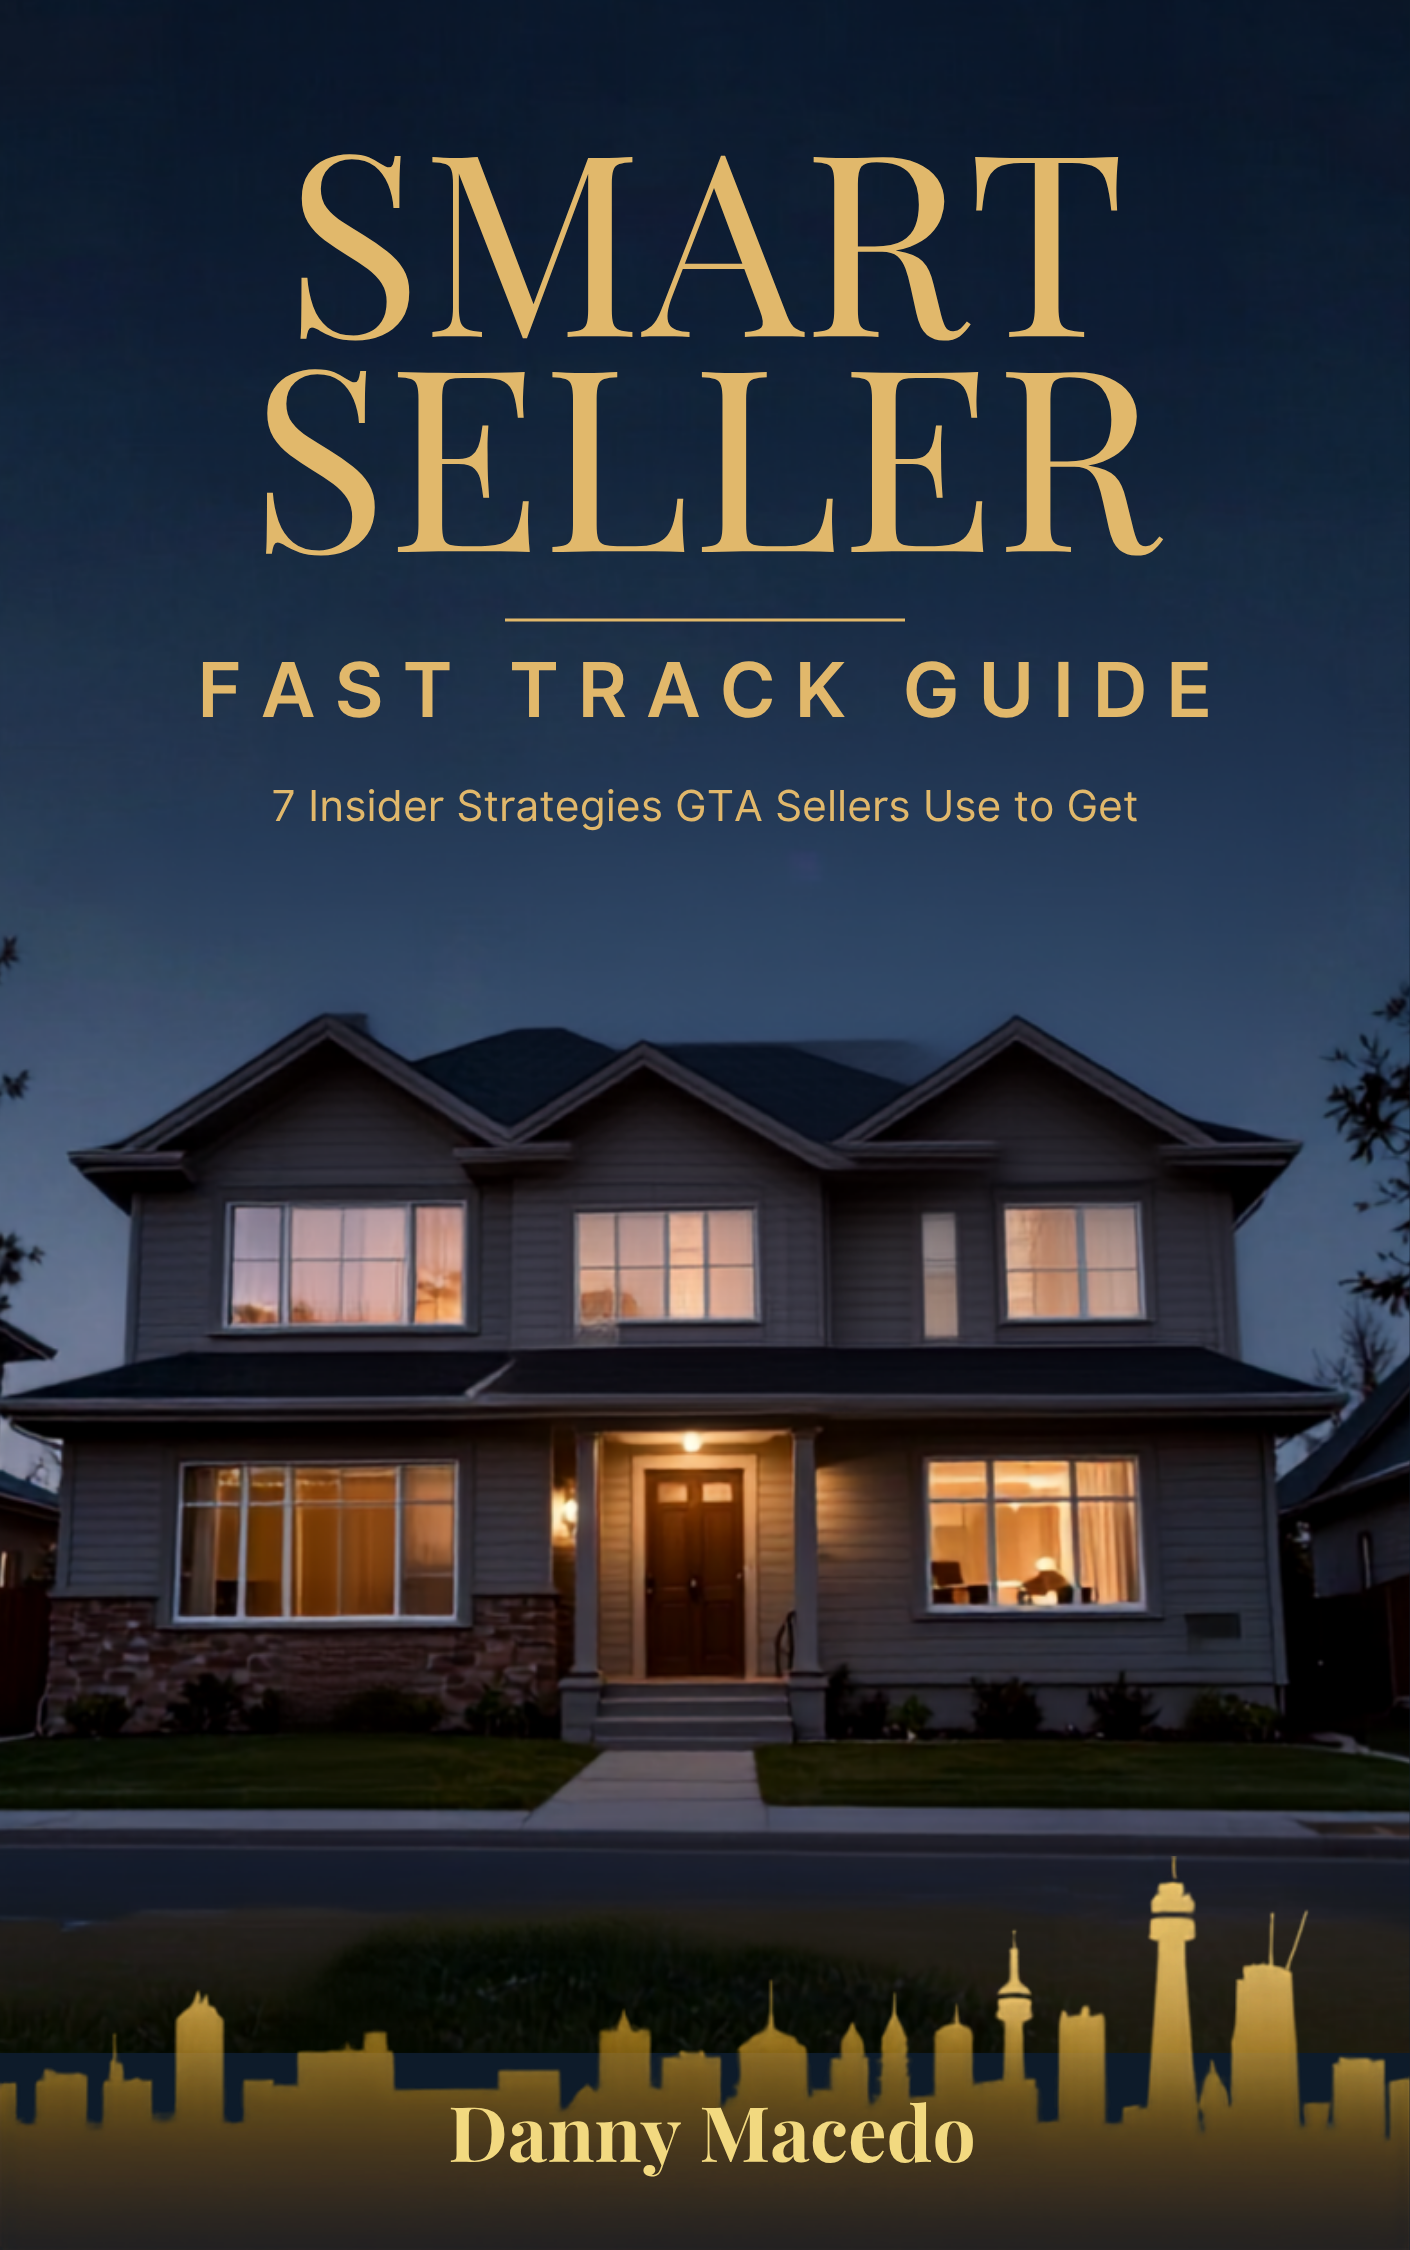
A MESSAGE FROM Danny Macedo
Why I Created This Guide
If you’re thinking about selling your home in the Greater Toronto Area, you already know this isn’t the market it was two years ago. Prices have shifted. Homes are taking longer to sell. Buyers have more choices and more negotiating power than they’ve had in years.
But here’s what most sellers don’t realize: the agents and homeowners who understand how to navigate this market are still getting exceptional results. They’re selling faster than average, closer to asking price, and often above what their neighbours got … because they follow a specific set of strategies that most sellers never learn.
After 30 years of selling real estate across the GTA … from luxury estates in King City to family homes across Toronto, I’ve distilled everything that separates the best outcomes from the average ones into this guide. These are the strategies my clients use. And now they’re yours.
Time Your Sale Using Market Momentum … Not Guesswork
Market Beyond the MLS … How Top Agents Create Demand
Your Pre-Listing Checklist




STILL NOT SURE?
Frequently Asked Questions
Understanding the process to selling a home in the Greater Toronto Area.
Question 1: How much is my home worth?
Your home’s value depends on recent comparable sales, current market conditions, location, property condition, upgrades, layout, and buyer demand. A professional home evaluation can help determine a realistic listing price.
Question 2: When is the best time to sell my home?
The best time depends on your goals, the local market, inventory levels, interest rates, and buyer activity. In many cases, the right pricing, preparation, and marketing strategy matter just as much as timing.
Question 3: What should I do before listing my home?
Before listing, it’s helpful to declutter, clean, complete minor repairs, improve curb appeal, and consider staging. These steps can help your home show better, attract more buyers, and potentially sell for a stronger price.
Question 4: How long will it take to sell my home?
The timeline depends on your property type, location, condition, price, and market demand. A well-priced and properly marketed home can generate stronger interest and help reduce time on the market.
TESTIMONIALS
What others are saying
"Service Above Expectations"
"We got out of our house and purchased a home in the community where we wanted to be. I know many people that haven’t had that kind of success. Thanks again for everything!"
- Annette Campagnaro

"Client Care Delivered"
"We were first-time buyers, and Danny Macedo made the whole process feel manageable, even exciting. Anytime we panicked or had questions, Danny or someone on his team got back to us fast, and they alwa ys took the time to explain our options."
- Jenny Roberts
"Trusted Guidance Given"
"Danny’s pricing guidance was spot-on, and he explained the neighborhood comps in a way that actually made sense, so we listed confidently. The best part was the negotiation, because he created momentum with multiple offers, pushed terms that protected us."
- Mike Groves

Royal LePage® Supreme Realty, Brokerage
110 Weston Road
Toronto, ON M6N 0A6
Call 416-535-8000
Text 647-931-5151


Copyright 2026. Macedo Real Estate Group, Danny Macedo, Sales Representative, Anthony Rocco Macedo, Sales Representative, Royal LePage Supreme Realty, Brokerage all rights reserved assumes no responsibility for the accuracy of any information shown. The information provided herein must only be used by consumers that have a bona fide interest in the purchase, sale or lease of real estate and may not be used for any commercial purpose or any other purpose.
Elite Broker Blogs
━━━━━━━━
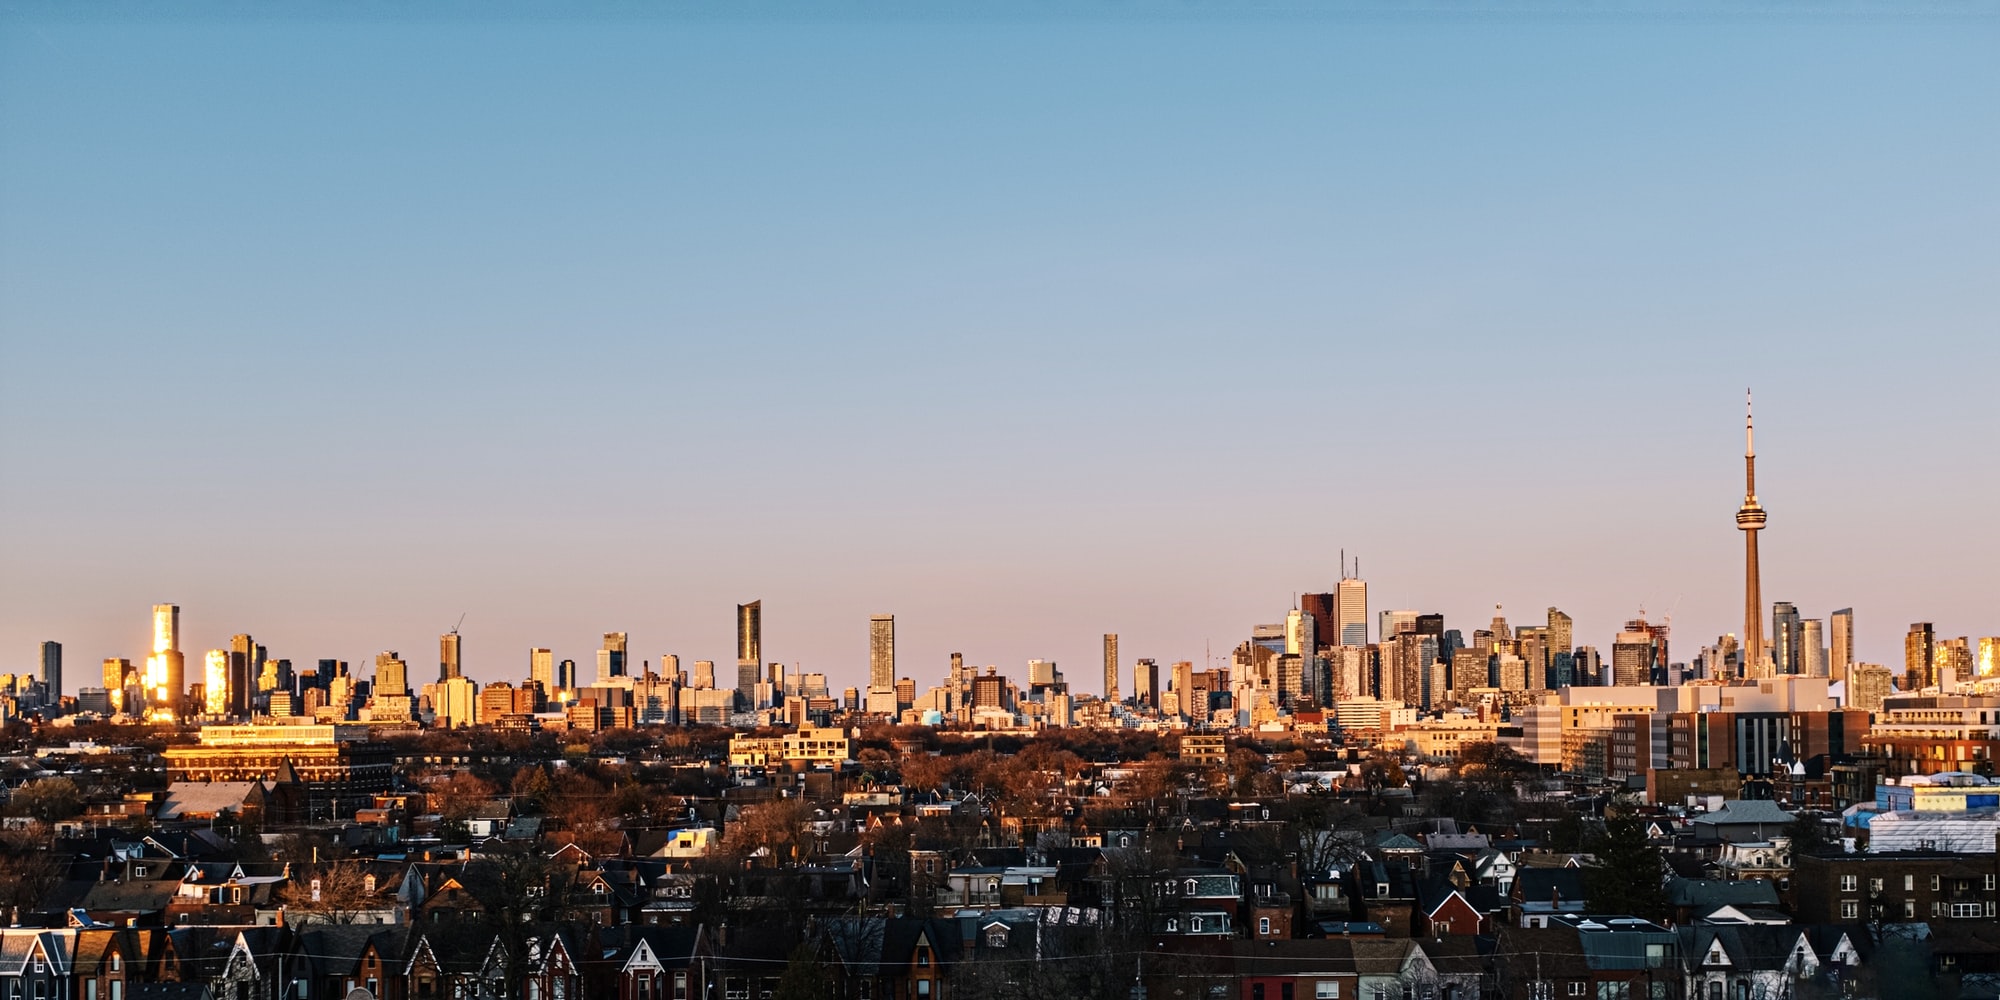
Where Sellers Got Asking Price in July 2026 and Where They Did Not
What the sale-to-list price ratio tells you
The sale-to-list price ratio, or SP/LP, compares what a property sold for against what it was listed at. A ratio of 100 per cent means the average sale in that area closed at the asking price. Above 100, sellers got more than they asked for. Below 100, buyers negotiated the price down.
It is not a perfect measure. An agent who deliberately lists low to attract multiple offers will produce a high SP/LP even in a soft market. An agent who lists high and expects negotiation will produce a low one. But across hundreds of sales in a given area, the ratio averages out those individual strategies and gives you a useful read on where the leverage sits.
In July 2026, the GTA-wide average SP/LP for all home types was 97 per cent. That single number hides a wide range.
Where sellers did best
Toronto East was the standout. The overall SP/LP for the Toronto East district was 101 per cent, the only broad area in the GTA where sellers averaged above asking price. Within Toronto East, three districts were notably higher. E01 came in at 104 per cent, E02 at 103 per cent, and E03 at 102 per cent. E07 and E05 both recorded 101 per cent.
These are established east-end neighbourhoods. Leslieville, Riverdale, the Danforth corridor, and the Beaches. Detached inventory is limited, demand from young families remains strong, and the result is competition that pushes sale prices above list.
Durham Region also performed well at 98 per cent overall, with Ajax at 99 per cent and Oshawa at 100 per cent. These are more affordable markets where entry-level buyers are active.
Source: TRREB Market Watch, July 2026. All Home Types, all figures for July 2026.
Where buyers had room to negotiate
The other end of the spectrum sat in the luxury pockets of Toronto Central. District C12, which includes the Bridle Path and surrounding estates, recorded an SP/LP of 93 per cent. District C03, covering Forest Hill and parts of Wychwood, also came in at 93 per cent. C02, which takes in the Annex and Yorkville, was 94 per cent.
King Township, Danny's home market, recorded 94 per cent. With an average sale price of $2,028,099 and only 20 sales in the month, the luxury end of the GTA consistently shows more room for negotiation. Caledon was similar at 95 per cent.
The pattern is consistent. The higher the price point, the more likely the buyer was able to negotiate below asking.
The middle ground
Most of the GTA sat between 96 and 98 per cent. That means sellers were giving back two to four per cent on average, which on a million-dollar home translates to $20,000 to $40,000 below asking.
Here is how the major regions compared:
Durham Region, 98 per cent. York Region, 98 per cent. Toronto West, 98 per cent. Peel Region, 97 per cent. Halton Region, 96 per cent. Toronto Central, 96 per cent. Simcoe County, 96 per cent.
Within those regions, individual municipalities varied. Markham came in at 99 per cent. Vaughan sat at 97 per cent. Mississauga was 97 per cent. Burlington and Oakville were both 96 per cent.
Source: TRREB Market Watch, July 2026. All Home Types by TRREB area.
What this means if you are buying
If you are shopping in Toronto East, expect competition. Offers at or slightly above asking are the norm, and conditional offers face stiffer resistance. In the $600,000 to $900,000 range in those east-end districts, the market is tighter than the GTA average suggests.
If you are shopping in the luxury brackets, whether in central Toronto, King, or Caledon, the data says you have negotiating room. A starting offer five to seven per cent below asking is not insulting in a market where the average sale closes at 93 to 95 per cent of list.
What this means if you are selling
Price to the market you are actually in, not the GTA average. If you are listing in Toronto East, the data supports pricing at or near the number you want, because the area is producing above-asking results. If you are listing a luxury property in C12 or King, the data says your buyer is likely to negotiate, and pricing with that expectation built in is better than pricing high and waiting.
The SP/LP ratio does not tell the whole story. Days on market, months of inventory, and the ratio of new listings to sales all contribute. But it is the one number that answers the simplest question a seller has: will I get what I am asking for?
In July 2026, the honest answer was: it depends entirely on where you are.
If you want to see how these numbers apply to your neighbourhood, call me at 416-560-4983.